Executive summary
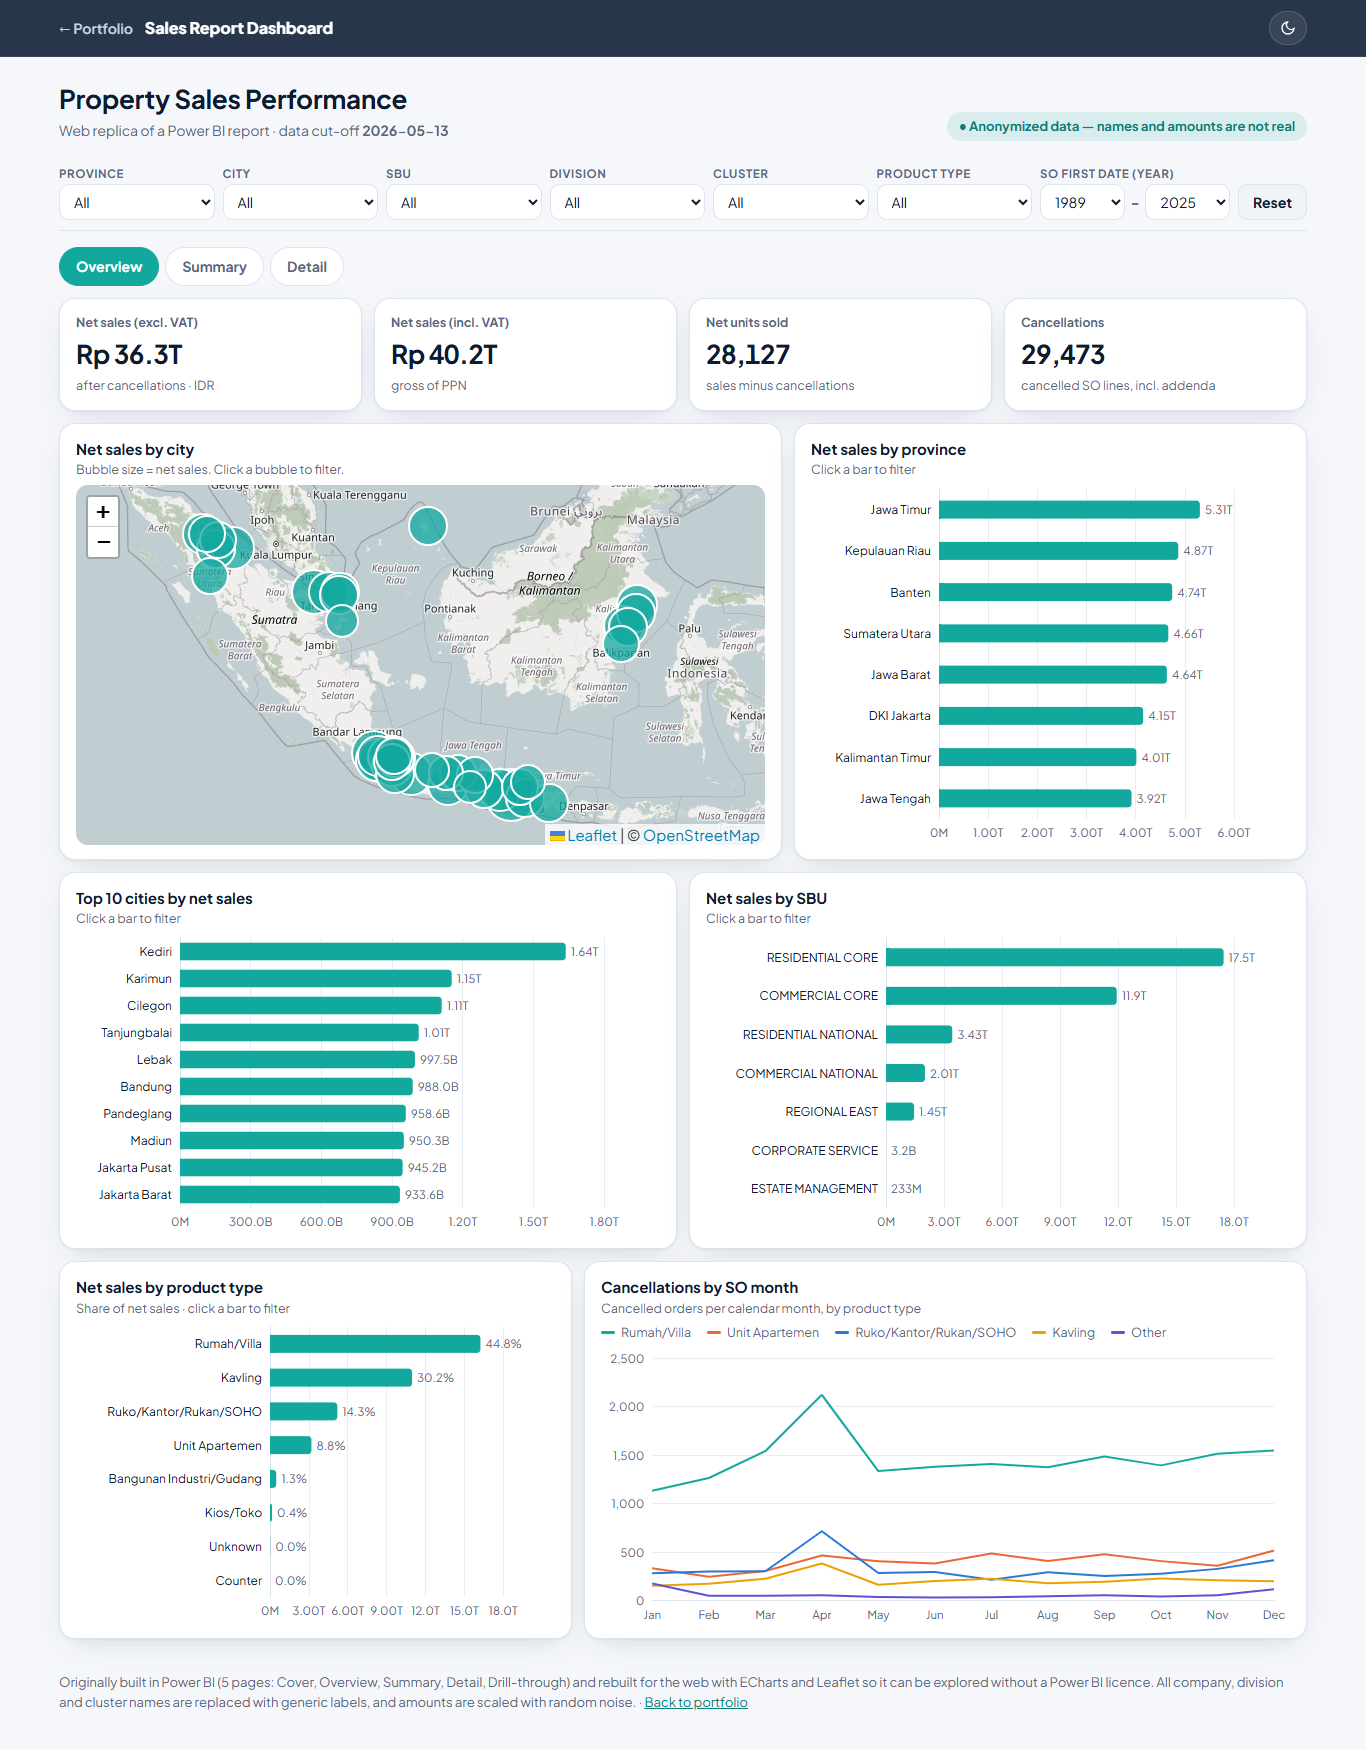
Sales Report Dashboard is an interactive property sales report. It was designed in Power BI for stakeholders who need a quick view of commercial performance (where sales come from, which business units drive them, and where cancellations happen) and was rebuilt as a static web page so anyone can explore it without a Power BI licence.
Features
Global filters
Province, City, SBU, Division, Cluster, Product type and SO year range. The City list narrows to the selected province.
Click to cross-filter
Clicking a bar or a map bubble applies that value as a filter, like cross-filtering in Power BI.
Sales map
Bubble map of net sales by city; bubble area is proportional to net sales.
Ranked comparisons
Net sales by province, top 10 cities, SBU and product type (with share of total).
Cancellation trend
Cancelled orders per calendar month, split by the four main product types plus Other.
Summary & detail tables
An expandable province → city summary, and a sortable, searchable, paginated detail table.
Light & dark mode
Follows the system setting and the portfolio's theme toggle; chart colours are re-validated for each mode.
Responsive
Works on phones: filters and charts stack, and axis numbers hide when space is tight.
Privacy by design
No real names or amounts are published; the original files stay in a private repository.
Report pages: Power BI → web
Each Power BI page and visual has a web counterpart:
| Power BI page | Power BI visual | Web dashboard |
|---|---|---|
| Cover | Title, logo, Last Refreshed card | Page header with data cut-off date (no company logo) |
| Overview | Slicers (7) | Sticky filter bar shared by all tabs |
| Overview | Azure Map (Province, City) | Leaflet bubble map on OpenStreetMap |
| Overview | Top 10 bar charts (Province, City, SBU) | ECharts horizontal bars with value labels |
| Overview | Donut: net sales by product type | Ranked bars with % share (easier to compare close values) |
| Overview | Line: Cancellation Province by month | Line chart by product type |
| Summary | Matrix (Province → City → SBU → Division → Cluster) | Expandable Province → City table with totals |
| Detail | Table | Sortable, searchable, paginated table |
| Detail | Drill Through | Drill-through page | Replaced by click-to-filter + the Detail tab |
Metric definitions
| Metric | Definition | Source column |
|---|---|---|
| Net sales (excl. VAT) | Sum of net sales excluding VAT. Cancellation lines are negative, so this is already net of cancellations. | SalesNetExPPNAmt |
| Net sales (incl. VAT) | Same as above, including VAT (PPN). | SalesNettInPPNAmt |
| Net units sold | Sum of unit quantity: +1 for a sale line, −1 for a cancellation line. | UnitQty |
| Cancellations | Number of sales-order lines whose order type is a cancellation (ZC01 / ZC02). Includes cancel-and-rebook addenda. | OrderType → IsCancel |
| Year filter | Year of the first sales-order date. | SOFirstDate |
| Cancellation month | Calendar month of the sales-order date. | MonthSODateNumber |
Amounts are shown in rupiah with T = trillion, B = billion, M = million.
Architecture
No backend
One HTML file plus data.json. Aggregation for every filter combination happens in the browser in milliseconds.
Compact data
Text values are stored once in dictionaries and rows reference them by index: 2.2 MB raw, about 0.5 MB gzipped.
Libraries
Apache ECharts 5.5 for charts, Leaflet 1.9 with OpenStreetMap tiles for the map, both loaded from a CDN.
Data & anonymization
The source is a sales-order view exported to Excel. Before anything was published, every identifying value was replaced:
| Field | Original | Published |
|---|---|---|
| Company | Real legal entity names | Company A, B, C… |
| SBU | Business-unit names incl. location | Generic: Residential Core, Commercial Core, Regional East… |
| Division | Real division names | Division A, B, C… |
| Cluster (373) | Real project / cluster names | Cluster 001, 002… |
| Amounts | Real rupiah values | × hidden random factor, plus ±15% noise per row |
| Order type | ZS01, ZC01, … | Removed; only the derived IsCancel flag is kept |
| Province, city, dates, product type | — | Kept (not identifying) |
How to use
Start with the Overview
The KPI tiles show the totals for the current filters; the map and bars show where sales come from.
Narrow down
Pick values in the filter bar, or click a bar or bubble. Press Reset to clear everything.
Compare regions
Open Summary and click a province to see its cities side by side.
Find specific rows
Open Detail, search by city, company or cluster, and click a column header to sort.
Tip: tabs can be linked directly, e.g. …/#summary or …/#detail.
Run locally
The page loads data.json with fetch, so serve the folder over HTTP rather than opening the file directly:
git clone https://github.com/diimasogan/PowerBI-SalesReport-Dashboard.git
cd PowerBI-SalesReport-Dashboard
python3 -m http.server 8000
# open http://localhost:8000
To rebuild this documentation after editing the text:
python3 -I docs/_source/build_docs.py
Limitations & notes
- Figures are anonymized and must not be read as real business results.
- The Cancellations metric counts ZC01/ZC02 order lines. It mirrors, but may not exactly match, the original Power BI measure
Cancellation Province. - The date filter works by year (Power BI used a date-range slicer).
- Drill-through is replaced by click-to-filter plus the Detail tab.
- Map bubbles use standard city-centre coordinates, because the source coordinates pointed to a single project location.
- The original .pbix and source data are kept in a separate private repository.